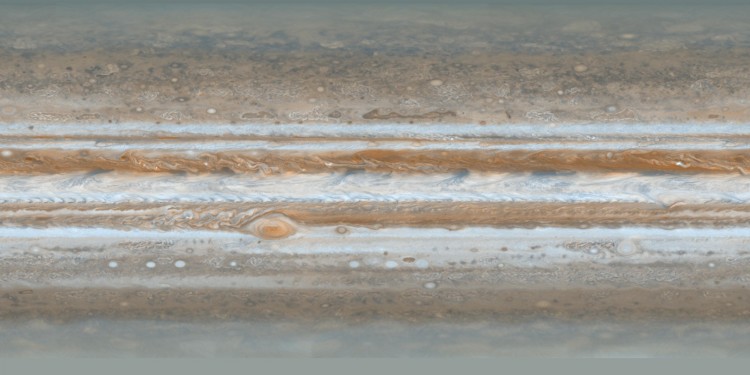
This color map of Jupiter was constructed from images taken by NASA’s Cassini spacecraft on Dec. 11 and 12, 2000, as the spacecraft neared Jupiter during its flyby of the giant planet. Cassini was on its way to Saturn. They are the most detailed global color maps of Jupiter ever produced. The smallest visible features are about 120 kilometers (75 miles) across.
この木星のカラーマップはNASAの土星探査機カッシーニが巨大な惑星である木星に最接近して通過した200年12月11日と12日に撮影したものです。カッシーニは土星に向かう途中でした。これはかつてない詳細な木星全体のカラーマップになりました。最小直径約120キロ(75マイル)のものまで確認することができます。
The map’s colors are close to those the human eye would see when gazing at Jupiter.
このマップの色合いは、実際に人間が木星を見た時の色合いに近いものです。
The maps show a variety of colorful cloud features, including parallel reddish-brown and white bands, the Great Red Spot, multi-lobed chaotic regions, white ovals and many small vortices. Many clouds appear in streaks and waves due to continual stretching and folding by Jupiter’s winds and turbulence. The bluish-gray features along the north edge of the central bright band are equatorial “hot spots,” meteorological systems such as the one entered by NASA’s Galileo probe. Small bright spots within the orange band north of the equator are lightning-bearing thunderstorms. The polar regions are less clearly visible because Cassini viewed them at an angle and through thicker atmospheric haze.
このマップでは、赤や茶色、白い帯状の雲や大赤斑、幾つかの混沌とした部分、白い楕円や多くの小さな渦巻きなど多様な特徴がよくわかります。多くの雲は木星の大気の風と嵐により伸び縮みさせられて波打っているように見えます。中央の北側の端に沿って見える明るい灰色の特徴的な帯は赤道の「ホットスポット」でNASAのガリレオ探査機によりプローブが投下された場所です。赤道北側のオレンジ色の帯にある小さな白い点は雷の稲光です。極地帯の画像はハッキリとしていませんが、それはカッシーニの撮影角度と薄い大気の影響によるものです。
Original caption and additional annotated versions are available from NASA’s Planetary Photojournal.
オリジナルキャプションと追加の注釈付きバージョンは、NASAの惑星フォトジャーナルから入手できます。
Credit : NASA/JPL/Space Science Institute
Data from the camera onboard NASA’s Juno mission, called JunoCam, will be made available to the public for processing into their own images. An example of this type of collaboration is illustrated here with an image of Jupiter taken by NASA’s Voyager mission, and processed by Björn Jónsson. The image highlights Jupiter’s “Great Red Spot.”
NASAの木星探査機ジュノー搭載の「ジュノーカム」というカメラのデータは、元画像を加工して一般に公開することができます。この画像がコラボレーションの例で、NASAのボイジャーミッションで撮影した木星の画像をビョルン・ヨンソンによって加工処理したものです。この画像は木星の「大赤斑」を取り上げたものです。
Additional images of Jupiter are available at NASA’s Planetary Photojournal.
Credit : NASA/JPL/Björn Jónsson
Credit : NASA/JPL
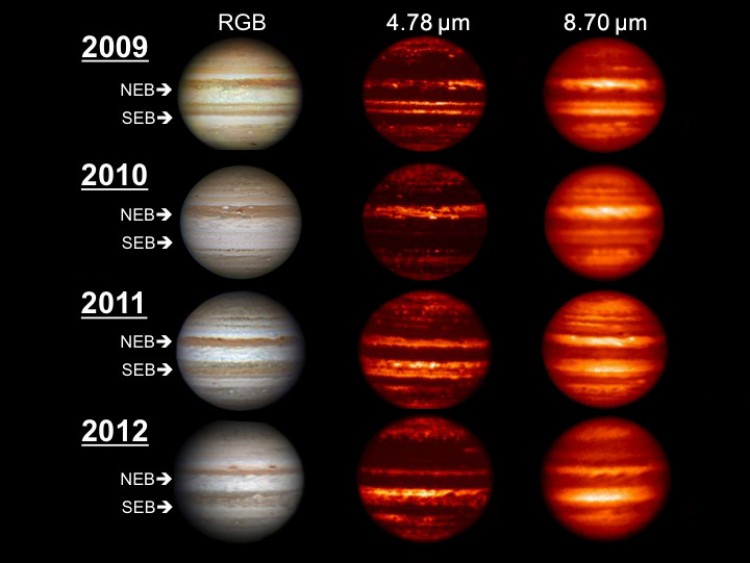
Global Upheaval at Jupiter
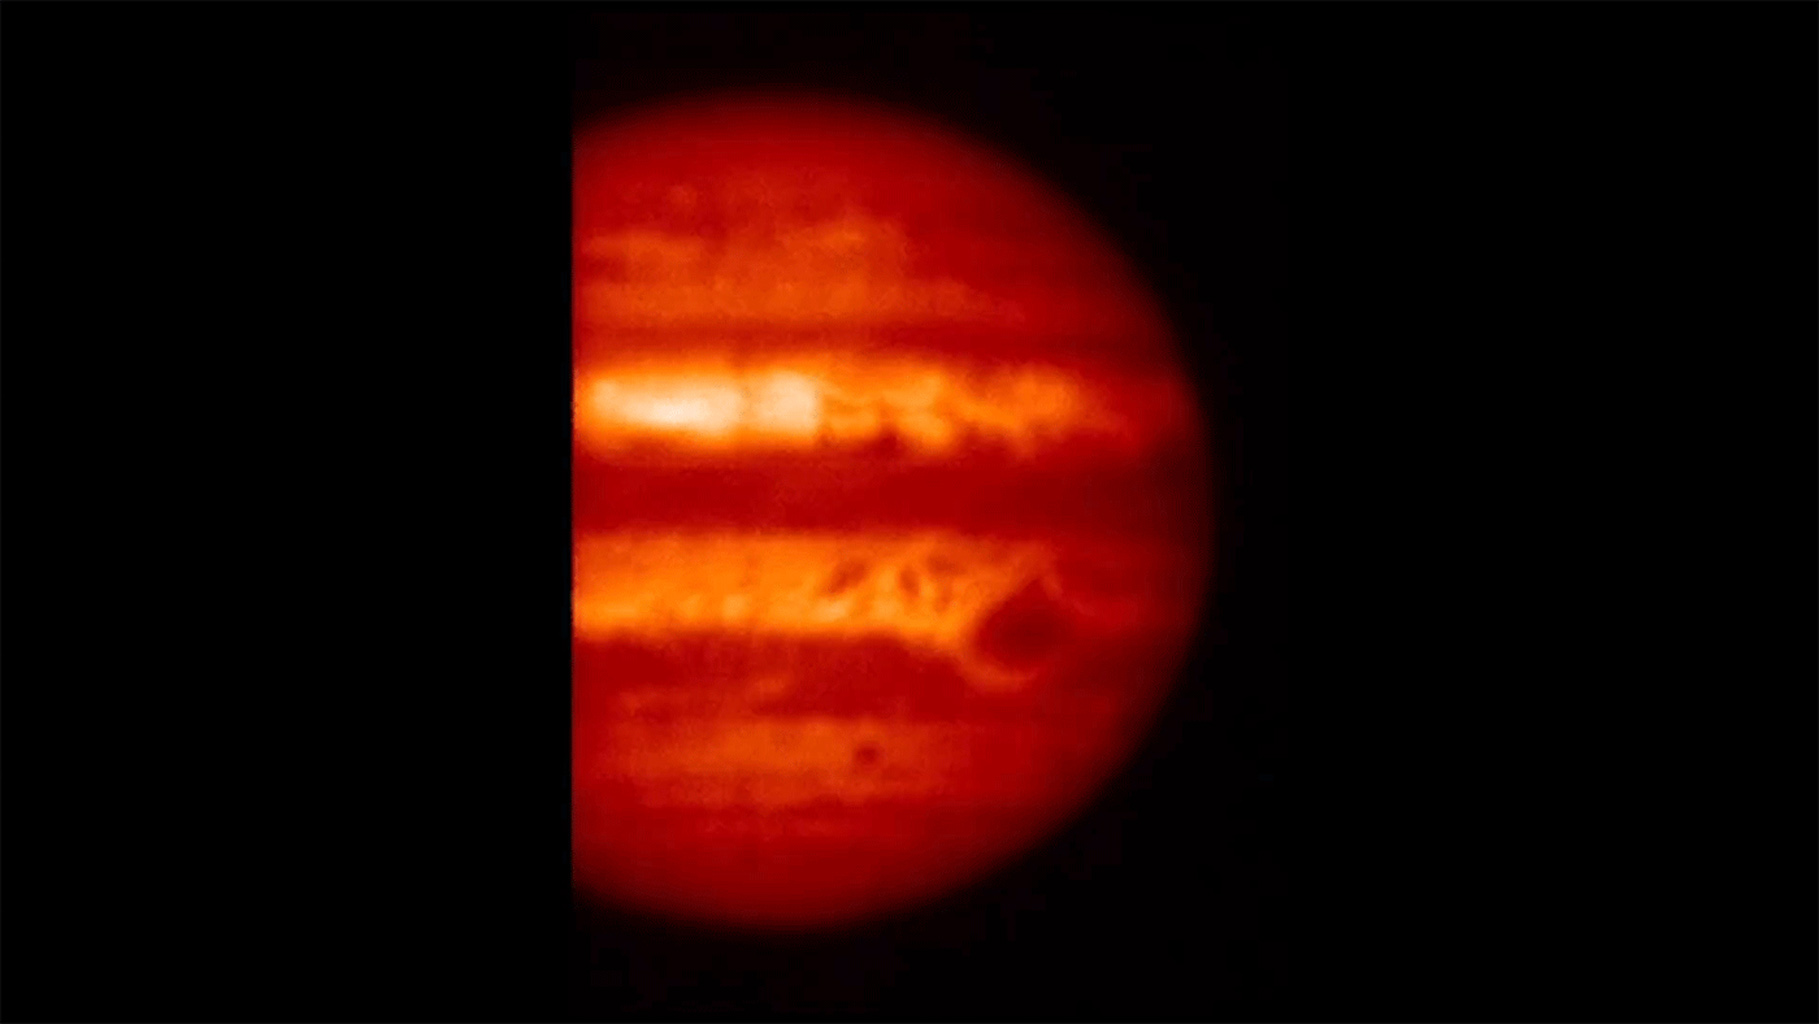
Images in the visible-light and infrared parts of the spectrum highlight the massive changes roiling the atmosphere of Jupiter. In the visible-light images on the left that were obtained by amateur astronomers, Jupiter can be seen “losing” a brown-colored belt south of the equator called the South Equatorial Belt (SEB) from 2009 to 2010. This belt returned in 2011 and was still present in 2012. From 2011 to January 2012, a belt north of the equator known as the North Equatorial Belt (NEB) can be seen to be thinning out. In 2011, it whitened to an extent not seen in over a century. In March of 2012, after the last picture in this series was taken, the northern belt began to darken again.
可視光と赤外線で木星の大気をみることで、大規模な動きが強調されるのでわかりやすくなります。左側の可視光画像はアマチュア天文家によるもので、赤道の南側の南赤道ベルト(SEB)と呼ばれる茶色のベルトが2009年から2010年にかけて消えているのがわかります。このベルトは2011年に再び現れ2012年でも存在しています。2011年から2012年1月にかけて、赤道の北側の北赤道ベルト(NEB)として知られている赤道のベルトが間引きするように薄くなっているのがわかります。2011年には、1世紀以上見られない程度に白くなりました。この一連の最後の写真が撮影された2012年の3月以降、北側のベルトは再び暗くなり始めました。
Scientists compared the visible-light data to data obtained in infrared wavelengths (middle and right columns), which show progressively deeper levels in the Jovian atmosphere. The infrared images were obtained from NASA’s Infrared Telescope Facility on Mauna Kea, Hawaii, except for the 2011 image in the 8.7-micron wavelength (right column, third from the top), which was taken by the Subaru Telescope, also in Mauna Kea, Hawaii. Those data showed a thickening of the deeper cloud decks in the northern belt during that time, and a partial thickening of the upper cloud deck. The South Equatorial Belt saw both levels of clouds thicken and then clear up. The infrared data also resolved brown elongated features in the whitened area of the North Equatorial Belt known as “brown barges” as distinct features and revealed them to be regions clearer of clouds and probably characterized by downwelling, dry air.
科学者たちは、可視光のデータと木星の大気の段々に深くなる様子を示す赤外波長のデータ(中央と右列)を比較しました。赤外線画像は、ハワイのマウナ・ケアにあるNASAの赤外線望遠鏡施設にあるすばる望遠鏡によって撮影されましたが、8.7ミクロンの波長の2011年の画像(右の列、上から3番目)は違います。これらのデータは、北側のベルトのより深い雲の厚さ、および上側の雲部分的な厚さを示ししています。南赤道帯は両方の雲の厚さがわかりましたが、その後消えてしまいました。赤外線データはまた、明確な特徴のある「茶色のはしけ」として知られている北赤道帯の白化領域の茶色の細長い部分が、おそらく乾燥した空気が沈降することにより生じたであろうことを明らかにしました。
Also visible in the infrared observations are a series of blue-gray features that are the clearest and driest regions on the planet and show up as apparent hotspots in the infrared view because they reveal the radiation emerging from a very deep layer of Jupiter’s atmosphere. Those hotspots disappeared from 2010 to 2011, but had reestablished themselves by June of this year, coincident with the whitening and re-darkening of the North Equatorial Belt.
また、赤外線観測で見えるものは、一連の青灰色の特徴のもので木星で最も澄んだ、最も乾燥した地域にあるホットスポットです。これは木星の大気の非常に深い層から出てくる放射線によって、見えてくるものなのです。これらのホットスポットは、2011年に2010から姿を消しましたが、今年の6月に赤道ベルトの北側に白と黒ずんだところに再びあらわれています。
The visible-light images were taken by A. Wesley (2009 and 2010), A. Kazemoto (2011) and C. Go (2012).
可視光画像はA.ウェスリー(2009年と2010年)、A. Kazemoto(2011)とC.ゴー(2012)によって撮影されました。
Original caption released with image: http://photojournal.jpl.nasa.gov/catalog/PIA16168
Credit : NASA/IRTF/JPL-Caltech/NAOJ/A. Wesley/A. Kazemoto/C. Go
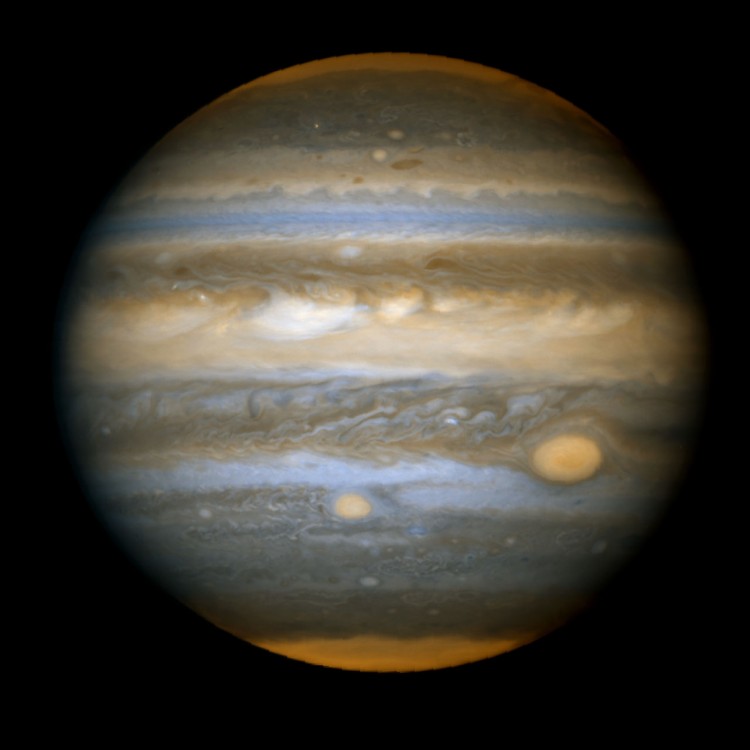
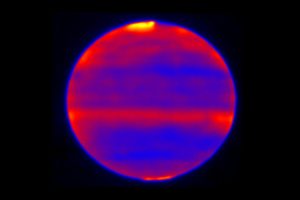
This false-color view of Jupiter was taken by the Hubble Space Telescope in 2006. The red color traces high-altitude haze blankets in the polar regions, equatorial zone, the Great Red Spot, and a second red spot below and to the left of its larger cousin. The smaller red spot is approximately as wide as Earth.
木星の色加工した画像は2006年にハッブル宇宙望遠鏡によって撮影されました。、赤色が極地の高々度に漂う塵、赤道、大赤斑、および2番目の小赤斑とその左側に大きめの小赤斑を表しています。小赤斑は地球の直径と同じくらいの大きさです。
Credit : NASA, ESA, I. de Pater and M. Wong (University of California, Berkeley) Original release: http://hubblesite.org/newscenter/archive/releases/solar-system/jupiter/2006/19/results/100/
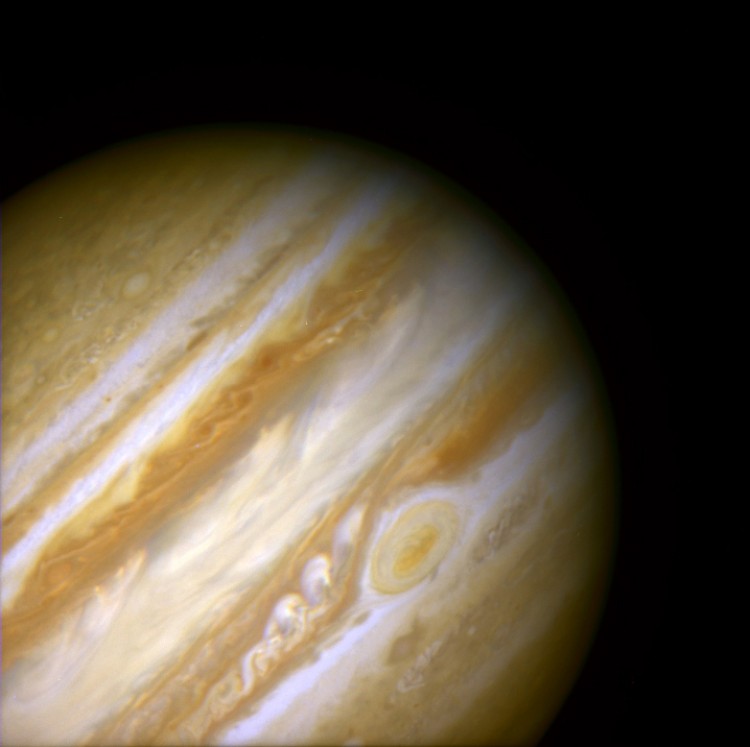
Jupiter as observed by the Hubble Space Telescope in June 1999.
1999年6月にハッブル宇宙望遠鏡で撮影された木星です。
Credit : The Hubble Heritage Team (STScI/AURA/NASA) and Amy Simon (Cornell U.) Original release: http://hubblesite.org/newscenter/archive/releases/solar-system/jupiter/1999/29/
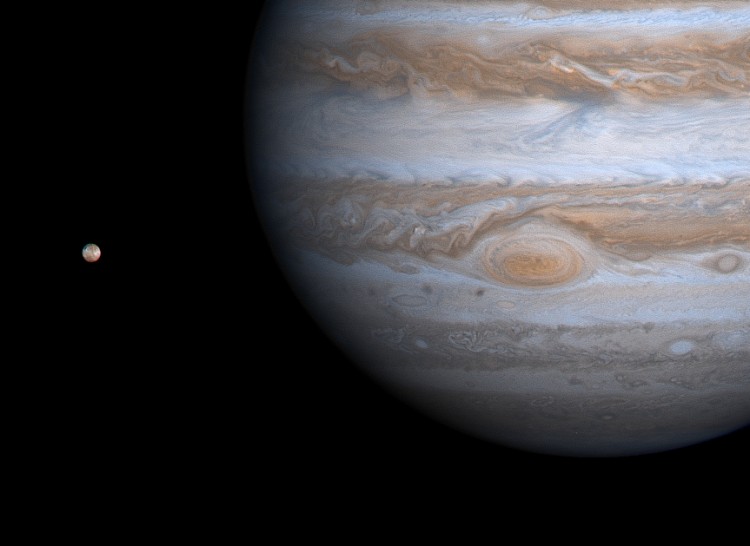
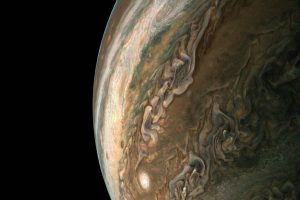
Image taken by NASA’s Cassini spacecraft on Dec. 1, 2000, shows details of Jupiter’s Great Red Spot and other features that were not visible in images taken earlier, when Cassini was farther from Jupiter.
2000年12月1日にNASAの土星探査機カッシーニが木星から離れた地点から撮影した画像は、木星の大赤斑の詳細とカッシーニが先に撮影した画像で見えなかった他の特徴が見えています。
The picture is a color composite, with enhanced contrast, taken from a distance of 28.6 million kilometers (17.8 million miles). It has a resolution of 170 kilometers (106 miles) per pixel. Jupiter’s closest large moon, Io, is visible at left.
この画像は2,860万キロ(1,780万マイル)の距離から撮影したもので、コントラストを強調したカラー合成画像です。解像度はピクセルあたり170キロ(106マイル)です。木星に最も近くて、最も大きな衛星であるイオが左側に写っています。
Credit : NASA/JPL/University of Arizona Full caption: http://photojournal.jpl.nasa.gov/catalog/pia02852
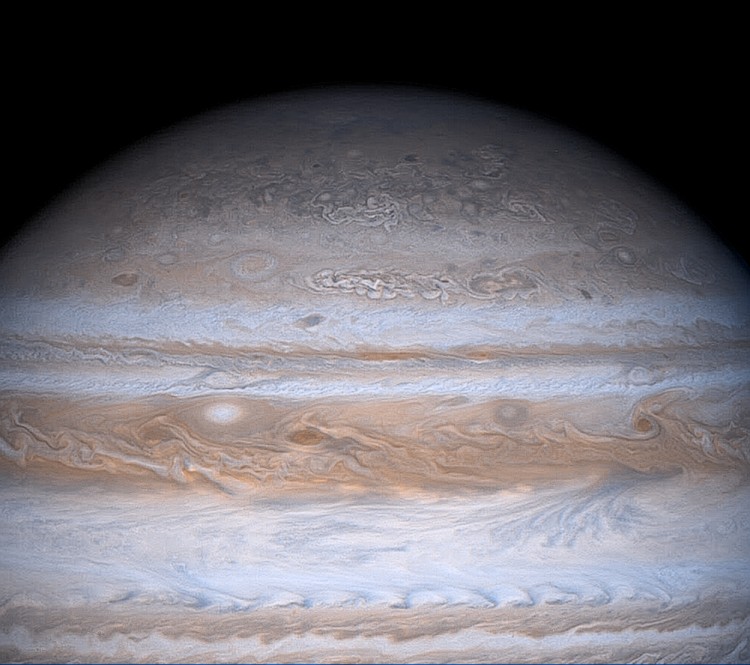
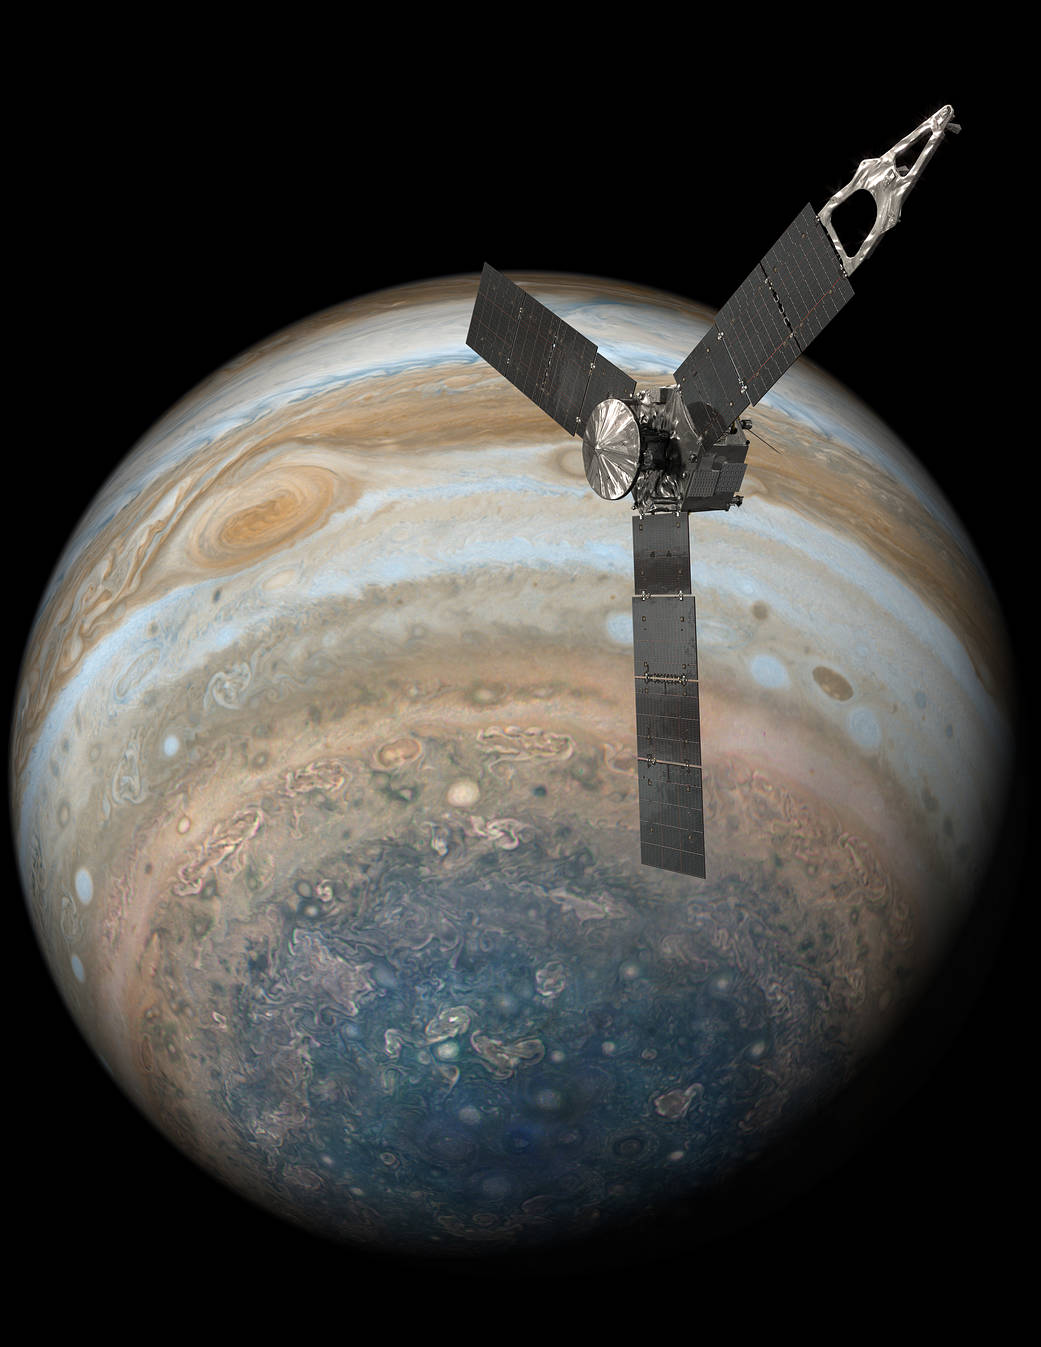
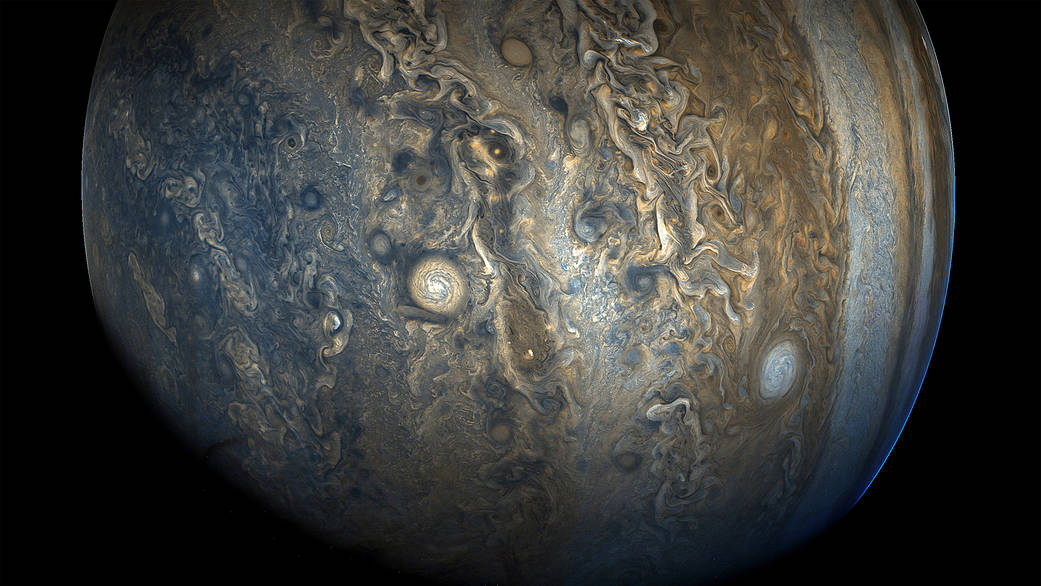
The familiar banded appearance of Jupiter gradually gives way to a more mottled appearance closer to the north pole in this true color image taken in 2000 by NASA’s Cassini spacecraft. The cause of the difference is not well understood. Juno will be the first spacecraft to get an up-close view of the planet’s unexplored polar regions.
2000年にNASAの探査機カッシーニが撮影したこのフルカラー画像で見る木星のおなじみの縞模様の外観は、徐々に北極に近づくにつれ、複雑な斑の様相を呈しています。このようになる原因は十分に解明されていません。ジュノーは木星の未踏の極地に接近して撮影をする最初の探査機となります。
Credit : NASA/JPL/University of Arizona Full caption: http://photojournal.jpl.nasa.gov/catalog/PIA02856
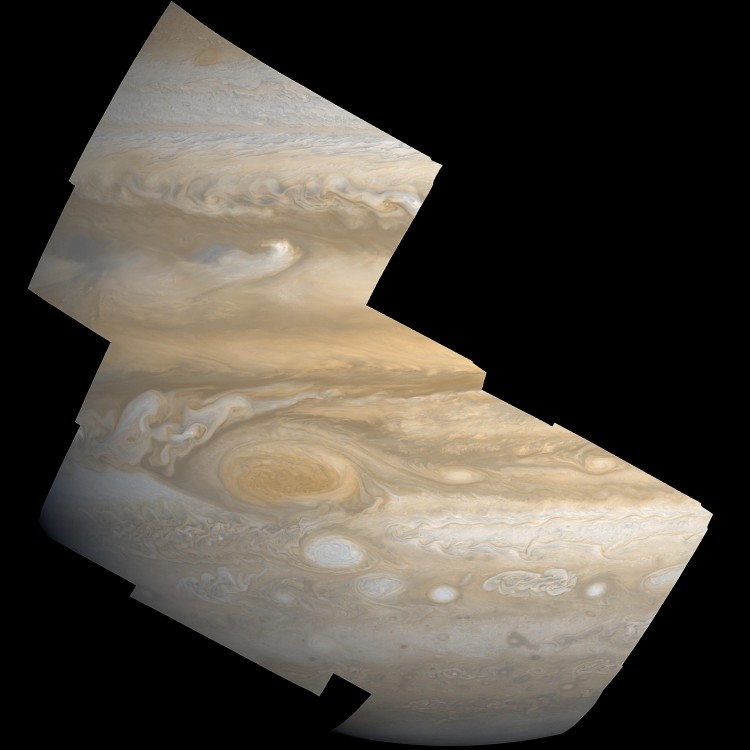
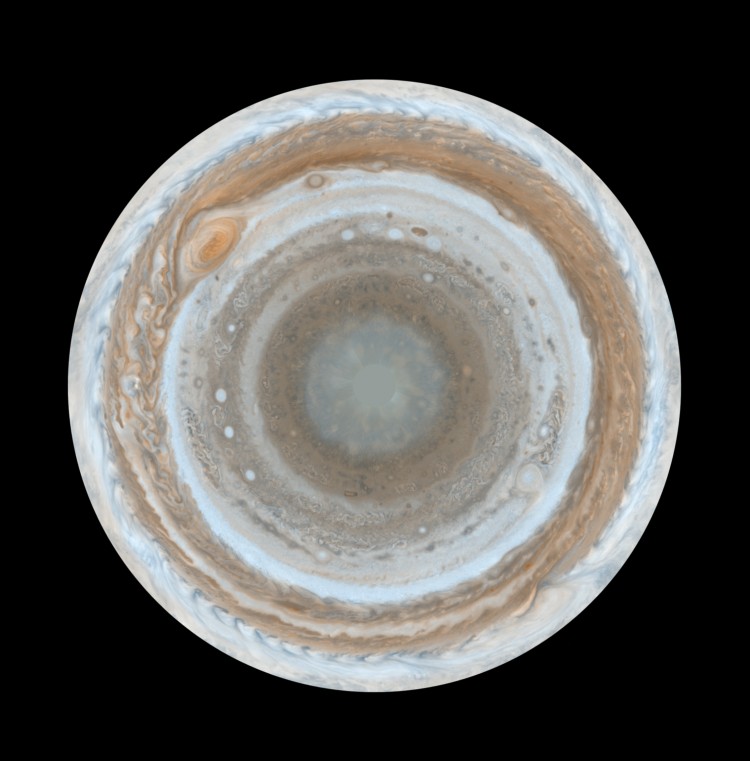
Jupiter’s northern half (its northern hemisphere) is shown, from pole to equator, in this map produced from images taken by the Cassini spacecraft in 2000. Cassini did not fly over either of Jupiter’s poles, but scientists were able to process their collection of images to create a view as if one were looking down onto the pole
2000年に探査機カッシーニが撮影した木星の赤道から北極までの北半分(北半球)の画像です。カッシーニは木星のいずれの極の上空も飛行しませんでしたが科学者たちは画像データを合成して北極から見下げたかのような画像を作り出しました。
Credit : NASA/JPL/Space Science Institute Full caption: http://photojournal.jpl.nasa.gov/catalog/PIA07783
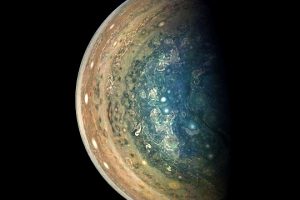
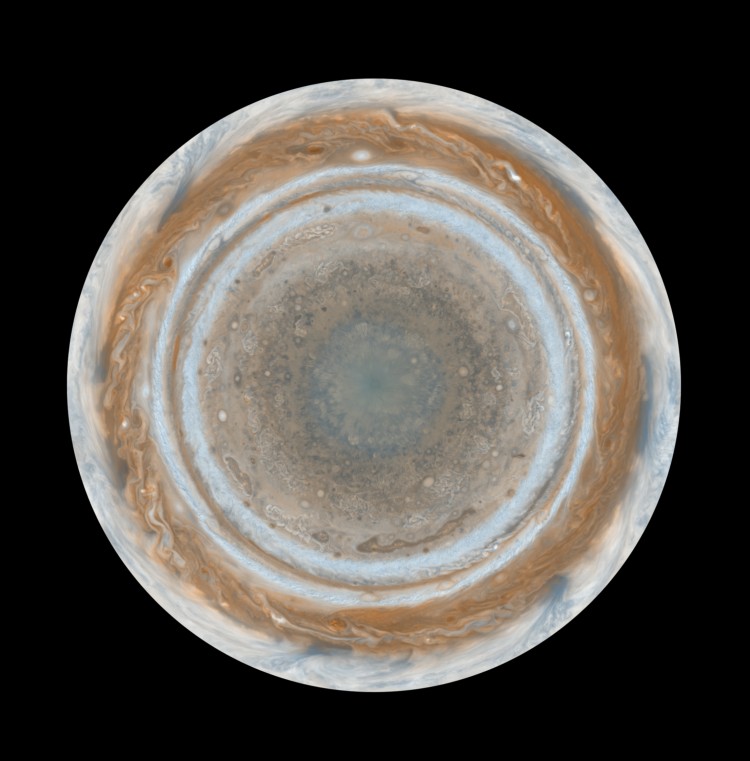
Jupiter’s southern half (its southern hemisphere) is shown, from pole to equator, in this map produced from images taken by the Cassini spacecraft in 2000. Cassini did not fly over either of Jupiter’s poles, but scientists were able to process their collection of images to create a view as if one were looking down onto the pole.
2000年に探査機カッシーニが撮影した木星の赤道から北極までの南半分(南半球)の画像です。カッシーニは木星のいずれの極の上空も飛行しませんでしたが科学者たちは画像データを合成して北極から見下げたかのような画像を作り出しました。
Credit : Original caption and additional download options: http://photojournal.jpl.nasa.gov/catalog/PIA07784
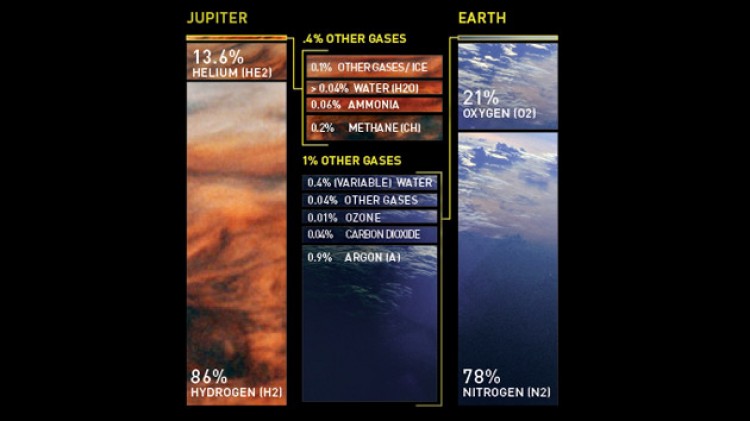
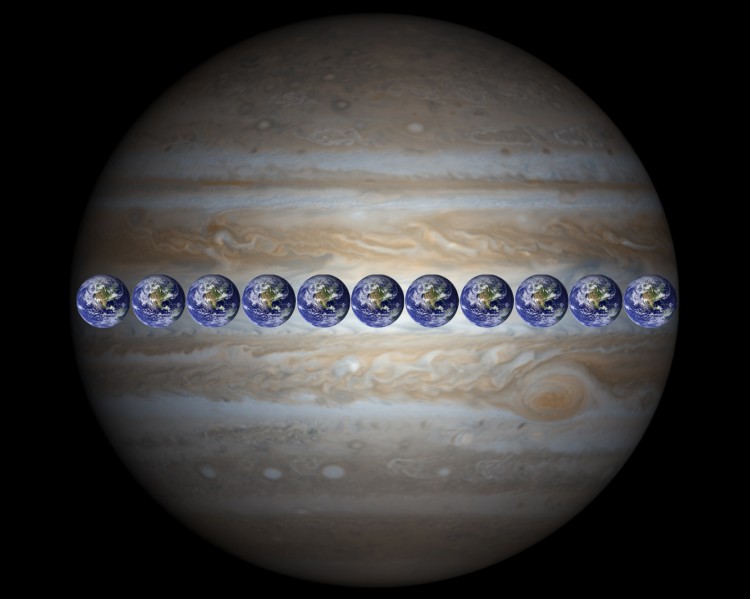
Diagram illustrating the different constituents of Jupiter and Earth and their relative proportions.
木星と地球の構成と性質がそれぞれ異なっていることを表しているイラストです。
Credit : NASA/JPL